Class
6
th
7
th
8
th
9
th
10
th
11
th
12
th
Close
Interpret bar graphs, line graphs and histograms
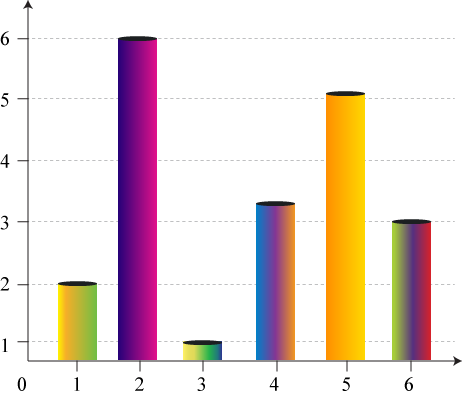
1) The bar graph shows the results when a die was thrown a number of times. How many sixes were thrown?
9
6
8
3
1/10
Solution
Answer:
3
Explanation:
The number of sixes is given by its frequency, or how high the bar is for the score 6.
So, look for 6 across the horizontal axis and then read off its frequency on the vertical axis.
There were 3 sixes.
Take a break!
You have watched Screen for 30 minutes, please relax your eyes by watching any other object at 20 feet for 20 secs.