Interpret stem leaf plots
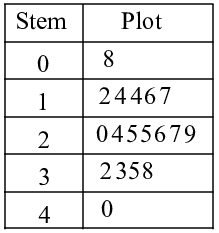
- 1) The stem and leaf plot below shows the grade point averages of 18 students. The digit in the stem represents the ones and the digit in the leaf represents the tenths. What is the range of the data in the stem and leaf plot?
- 3.2
- 3.9
- 3.6
- 3.8